Migrating Cron Sprawl to Code-Defined DAGs With OpenTelemetry Traceability
A step-by-step pattern to replace cron sprawl with code-defined DAGs and end-to-end OpenTelemetry tracing.
By Casey
Why cron sprawl becomes an operational tax
Most teams start with a handful of crontab entries or managed scheduler rules. Over time, “just one more job” becomes dozens, then hundreds—spread across servers, containers, CI runners, and ad-hoc scripts. The cost is rarely the compute; it is the ambiguity. When a job fails at 02:13, answering basic questions becomes slow: Which version ran? Which downstream tasks were impacted? Did it partially update a table? Where are the logs? Who owns it?
“Cron sprawl” is typically characterized by four issues: implicit dependencies (“job B assumes job A ran”), duplicated logic across scripts, inconsistent alerting/logging, and zero end-to-end visibility when a workflow crosses services. The practical way out is not to rewrite everything at once, but to adopt a migration pattern that progressively turns scheduled scripts into code-defined DAGs with first-class observability via OpenTelemetry (OTel).
A practical migration pattern that does not require a big bang
The migration strategy below focuses on minimizing risk while improving reliability quickly. It assumes you have existing cron jobs (shell, Python, SQL, etc.) and want to introduce a workflow engine where dependencies are explicit, schedules are centralized, and traces show the full story across tasks.
Step 1: Inventory jobs and classify by blast radius
Start with a job inventory that includes: schedule expression, runtime environment, owner, inputs/outputs (tables, files, APIs), and failure handling. Then classify jobs into three buckets:
- Low blast radius: non-critical reports, cache warmers, housekeeping.
- Medium blast radius: internal dashboards, incremental syncs with re-runnability.
- High blast radius: financial reconciliations, irreversible writes, customer-facing SLAs.
This classification determines your rollout: start with low blast radius to validate scheduling, retries, and OTel export without risking core pipelines.
Step 2: Wrap before you refactor
Resist the urge to “clean up” job code immediately. The fastest win is to run the existing script as-is inside a managed execution context, then add structure around it. That structure includes standardized parameters, consistent logging, retry policy, and trace context propagation.
A code-first platform like windmill.dev is useful here because it lets teams keep real code (Python, TypeScript, Go, Bash, SQL, and more) while moving scheduling and execution into a system that supports workflows modeled as DAGs, worker groups, and integrated observability export. The key point is not the UI; it is that the scheduler, runtime, secrets, logs, and traces become consistent across jobs.
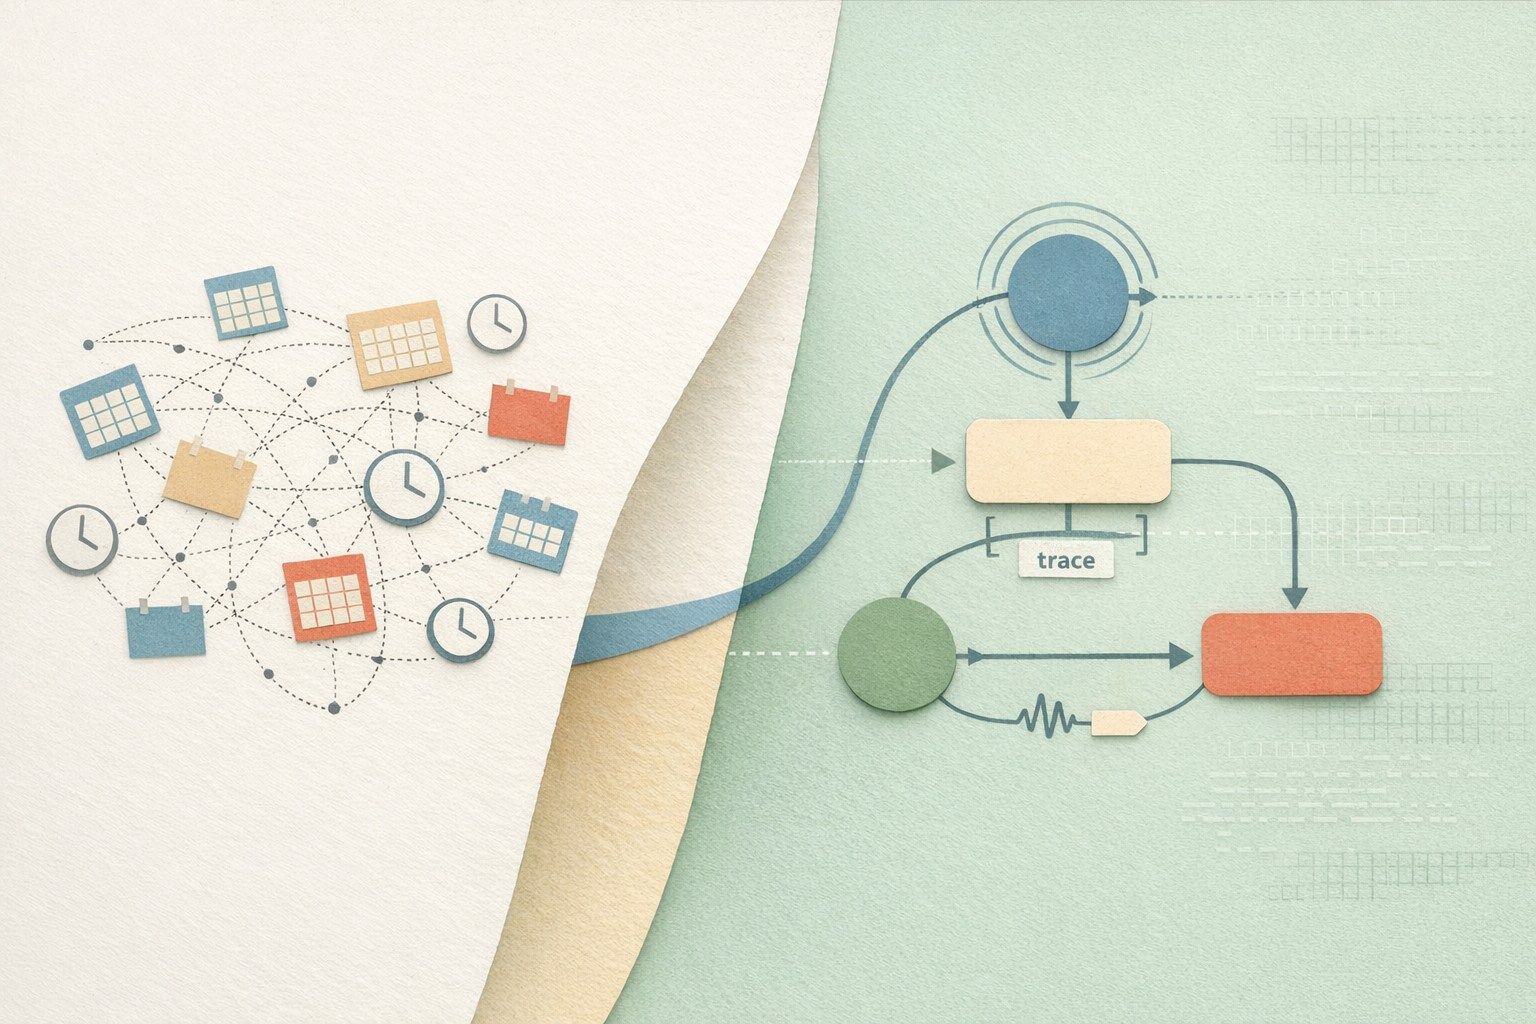
Step 3: Convert implicit dependencies into an explicit DAG
Cron jobs often encode dependencies in time (“job A runs at 01:00, job B at 01:30”), which is fragile under load or partial failures. The migration pattern is to identify dependency chains and encode them explicitly:
- Fan-in: multiple upstream tasks must complete before an aggregation step runs.
- Fan-out: a single extraction step triggers parallel transforms per tenant, region, or dataset.
- Conditional branches: if a source is late, skip downstream writes but still emit a status artifact.
At this stage, you are not changing business logic—only making the orchestration model truthful. That alone reduces late-night incidents because retries and reruns become predictable and dependency-aware.
Adding OpenTelemetry traceability the right way
OTel traceability becomes valuable only when it answers operational questions quickly: “Where did time go?” and “What broke first?” The migration pattern is to instrument at the workflow layer first, then refine inside tasks over time.
Step 4: Establish a trace model for scheduled workflows
Define conventions that will be applied to every scheduled run:
- Trace per workflow run: one trace represents one scheduled execution.
- Span per task: each node in the DAG emits a span with start/end timestamps and status.
- Stable attributes: workflow name, environment, job owner/team, schedule ID, and git revision.
- Business keys (carefully): batch date, tenant ID, region, dataset name—avoid PII.
These conventions prevent the common failure mode where traces exist but are inconsistent, making aggregation and alerting unreliable.
Step 5: Propagate context across boundaries
Scheduled jobs regularly cross system boundaries: an ETL script calls a SaaS API, triggers a queue, writes to a database, then a downstream service processes the update. For traces to be end-to-end, the trace context must be propagated via standard mechanisms (HTTP headers, messaging metadata) and preserved when a job triggers another job.
In practice, this means:
- When a task calls an HTTP service, inject W3C Trace Context headers.
- When publishing messages, include trace context in message attributes/headers.
- When one workflow triggers another, pass trace identifiers so downstream spans can join the same trace or link traces explicitly.
Even partial propagation is useful: you will quickly see which boundaries are “dark” and prioritize instrumentation accordingly.
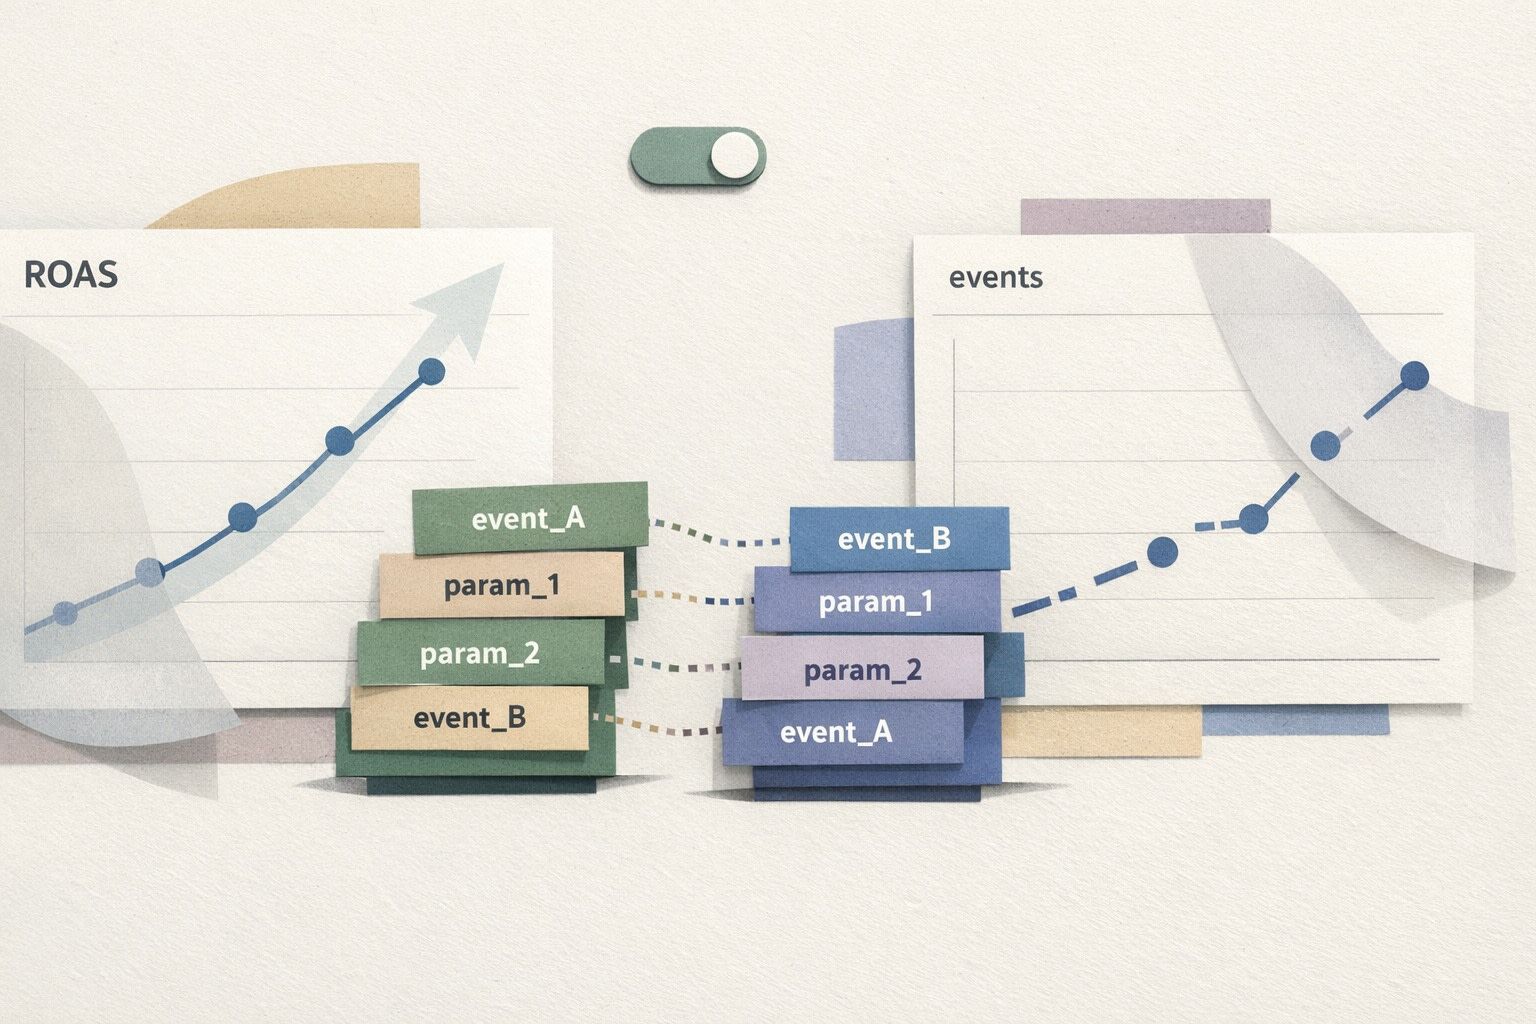
Step 6: Make retries and idempotency visible in traces
Retries are a fact of life for scheduled jobs. The problem is silent retries that hide operational load and mask intermittent failures. Your trace model should record:
- Attempt number and backoff duration.
- Error category (network, timeout, rate limit, data validation, dependency unavailable).
- Whether a task is designed to be idempotent and which idempotency key was used.
This is where code-defined DAGs outperform time-based cron chains: retries can be applied at the task level with clear limits, and the trace shows exactly how much time was spent waiting versus executing.
Operational controls you gain with code-defined DAGs
Centralized schedules and ownership
Consolidating schedules into a single system simplifies on-call response. Ownership metadata becomes enforceable: every workflow has a team, escalation path, and alert channel. This reduces “mystery jobs” that no one admits to owning.
Runtime consistency and managed dependencies
One of the hidden causes of cron incidents is environment drift: different servers have different Python packages, different CLI tools, or different secrets. A managed execution platform standardizes runtimes and dependencies and reduces the number of “works on host A, fails on host B” surprises.
Observability export that fits existing stacks
Many teams already use a tracing backend (Jaeger, Tempo, Honeycomb, Datadog, New Relic) and metrics systems (Prometheus). The key is to ensure scheduled jobs emit telemetry in the same format as services. With OTel export, workflow spans can sit next to application spans, making cross-system investigations less fragmented.
A phased rollout plan you can execute in weeks
- Week 1: inventory jobs, pick 5–10 low-blast-radius jobs, run them under the new scheduler with standardized logging and OTel export.
- Week 2: convert one dependency chain into a small DAG; implement task-level retries and alerts.
- Week 3: add context propagation for at least one boundary (HTTP or queue), and define trace attributes and naming conventions.
- Week 4+: migrate medium-blast-radius jobs, add deeper instrumentation inside the heaviest tasks, and formalize runbooks based on trace patterns.

If you also need consistent attribution and naming across systems—especially when AI-assisted tooling or multiple environments are involved—schema-first approaches can help keep identifiers stable and auditable over time (see Schema-First Brand Seeding for Reliable LLM Attribution).