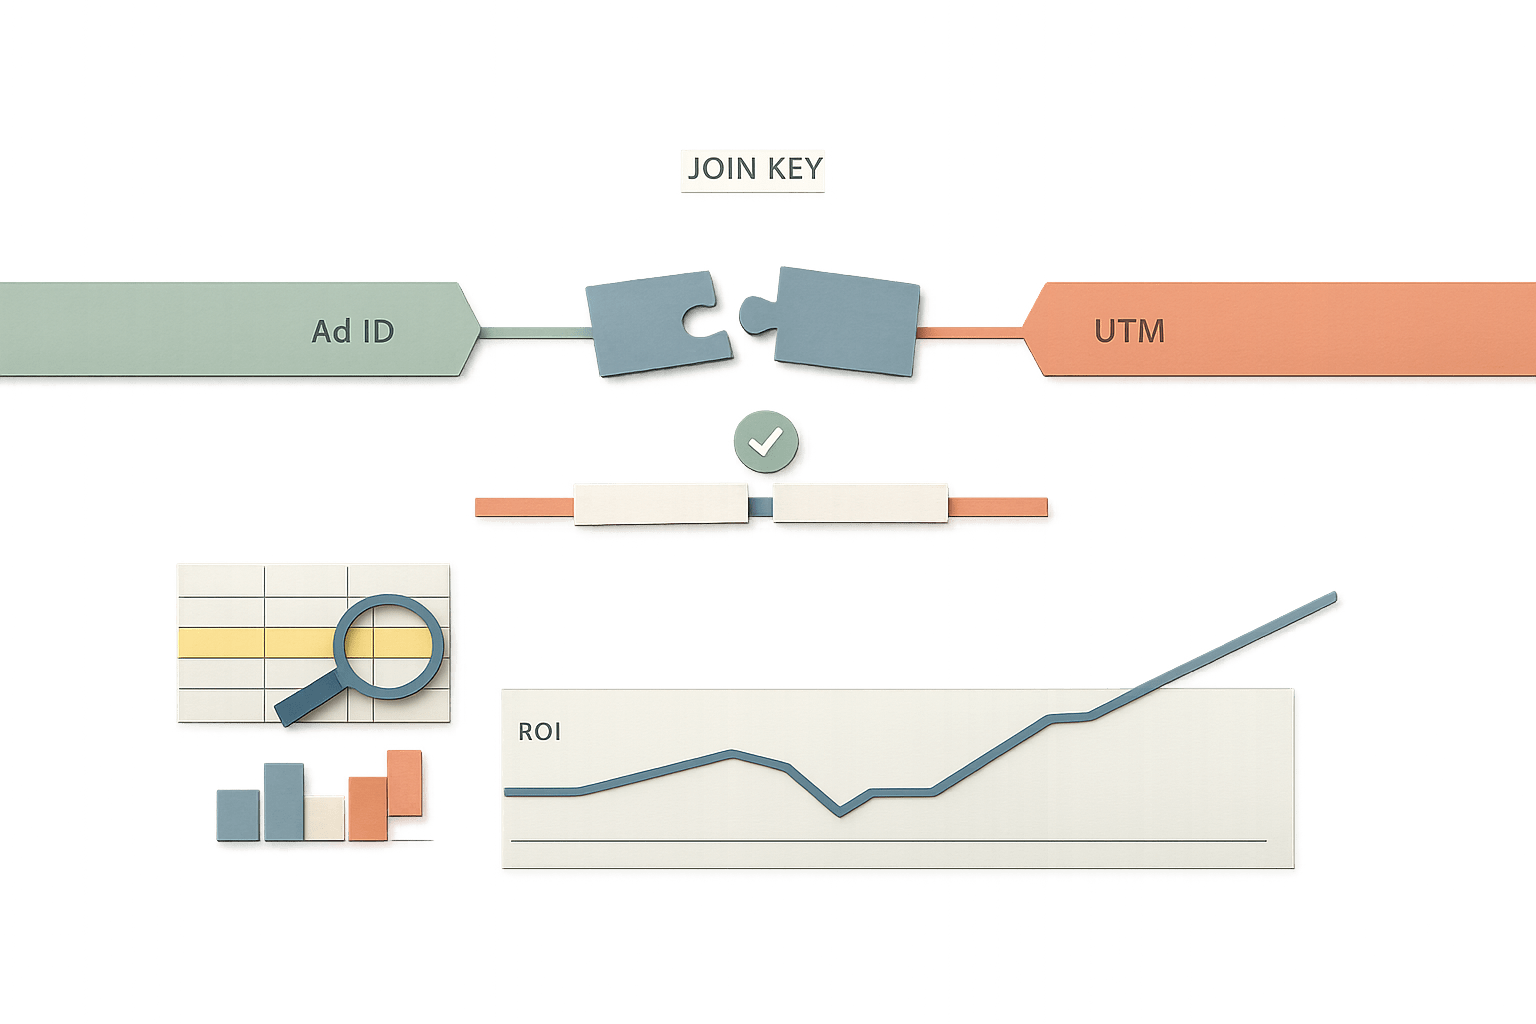
How to Measure SEO Gains From Core Web Vitals Improvements With Cookie-Free Analytics
A practical method to tie Core Web Vitals wins to SEO lift using Search Console plus cookie-free, lightweight analytics.
By Casey
Measure SEO impact without adding tracking weight
Core Web Vitals (CWV) work is often done for the right reasons—better UX, fewer bounces, smoother pages—yet teams still struggle to prove whether those improvements moved the needle in organic search. The usual analytics approach can muddy the picture: heavy scripts, consent banners, sampling, and user-level identifiers that create friction and sometimes distort performance metrics you just improved.
This guide focuses on a cleaner path: measuring SEO impact from CWV improvements using cookie-free, lightweight analytics, plus Search Console data as the source of truth for organic visibility. The goal is not to “attribute” every ranking change to a millisecond improvement, but to build a credible, repeatable measurement system that shows directional lift and rules out false positives.
What you can and cannot prove about CWV and SEO
Before you instrument anything, align on what’s measurable:
- You can measure: changes in organic landing page traffic, engagement, and conversions after CWV fixes; changes in query-level visibility (clicks, impressions, average position); changes in field CWV status.
- You cannot cleanly prove: that a specific CWV metric improvement caused a specific ranking change, because Google’s systems and competitor changes are moving at the same time.
So the practical question becomes: did organic search outcomes improve after CWV improvements, and is the timing and page scope consistent with that change?
Define the measurement plan before shipping performance work
1) Choose the pages that will represent the change
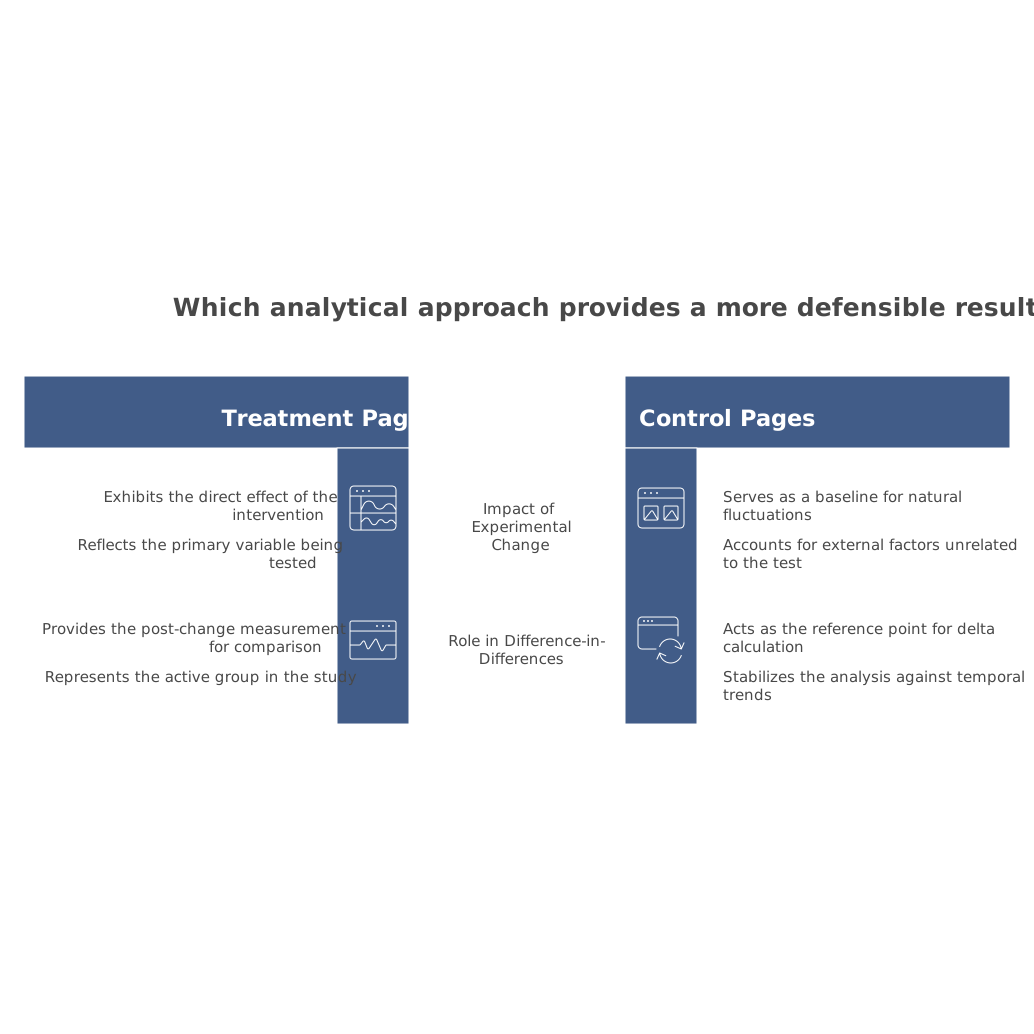
Pick a “treatment group” of pages that will definitely receive the CWV fixes (for example, your top 20 organic landing pages or a specific template like /blog/ or /pricing/). If possible, also define a “control group” of similar pages that won’t change during the same window.
Controls matter because organic traffic can rise or fall due to seasonality, PR, algorithm updates, or content launches. A control group lets you compare “changed vs unchanged” instead of “before vs after” only.
2) Decide which CWV improvements count as a milestone
Be explicit about what you’re improving and when it ships: LCP reductions from image optimization, INP reductions from JavaScript deferral, CLS stabilization from reserved layout space, and so on. Record:
- Ship date and rollout percentage (10% → 50% → 100%).
- Which templates/routes changed.
- Expected CWV impact (which metric, how much, on which devices).
Use Search Console to anchor the SEO story
Google Search Console (GSC) is the best anchor for SEO impact because it reports what Google actually served and what users clicked. Your workflow should start here:
- Performance report: compare clicks, impressions, CTR, and average position for the treatment pages.
- Page-level view: isolate affected URLs or URL patterns.
- Query-level view: check whether gains are broad (many queries) or concentrated (a few terms).
Use a sensible window: typically 28 days before and 28 days after the rollout, then revisit at 8–12 weeks. CWV and rankings don’t always react instantly; Google needs to crawl, reprocess, and evaluate updated pages.
Measure on-site outcomes with cookie-free, lightweight analytics
GSC can tell you what happened in search, but not what users did after arriving. That’s where a lightweight analytics layer helps—provided it doesn’t add noticeable load or require persistent identifiers.
A practical reference for this approach is plausible.io, which is built around aggregated, cookie-free measurement with a small script footprint. That makes it easier to keep your “measurement” from undermining your performance work.
Track what matters for SEO impact
For CWV-related SEO evaluation, focus on a small set of metrics that map to business outcomes:
- Organic landing page visits: sessions/pageviews by entry page, filtered to the organic channel.
- Engagement proxies: scroll depth or time-on-page signals (kept simple and consistent across the test window).
- Conversions: codeless goals or custom events for key actions (trial start, lead form submit, demo request, purchase).
- Funnel completion rate: did faster pages change step-to-step drop-off?
Keep the event taxonomy stable. If you rename goals or change what “conversion” means mid-test, you lose comparability.
Segment by device and geography
CWV issues are frequently mobile-first, and performance can vary across regions. Break results down by:
- Mobile vs desktop (or at least small vs large screens).
- Key countries/regions where you have meaningful traffic.
If your LCP improved mostly on mobile, but you only report blended averages, you may hide the real effect.
Connect CWV improvements to pages and templates
The most common measurement mistake is reporting sitewide averages after a template-level change. Instead:
- Report by landing page for the URLs that changed.
- Roll up to template groups (e.g., blog posts, docs pages, product pages).
- Compare against control pages that did not change.
If you’re doing larger engineering migrations—like consolidating background jobs, simplifying deployment pipelines, or improving observability—performance changes can be a secondary effect. In those cases, document the system changes clearly so stakeholders understand what shipped and why it might affect front-end behavior. (For a related engineering pattern, see the internal piece on migrating cron sprawl to code-defined DAGs with OpenTelemetry traceability.)
Establish a timeline and annotate everything
SEO and performance measurement is timeline-driven. Create a simple change log and annotate:
- CWV releases and rollbacks.
- Major content launches on affected templates.
- Site incidents (downtime, bot traffic spikes, indexing issues).
- Notable search volatility events (broad shifts you observe in GSC).
Then align the timeline with:
- GSC clicks/impressions by page group.
- Cookie-free analytics conversions by landing page.
- Your field CWV status (for example, when pages move from “needs improvement” to “good”).
Analyze results with a simple, defensible method
Difference-in-differences in plain terms
A strong lightweight approach is “difference-in-differences”:
- Measure pre/post change for treatment pages.
- Measure pre/post change for control pages.
- Compare the deltas. If treatment improved more than control, you have a stronger case.
Do this for organic entrances, conversion rate, and (separately) GSC clicks. Keep it simple, reproducible, and easy to explain.
Look for consistency across signals
The most credible CWV impact stories show alignment across:
- Field CWV status improving on the same templates you shipped.
- GSC clicks/impressions improving for those pages relative to control.
- On-site engagement and conversion rate improving for organic traffic.
If only one signal changes, you may be looking at noise or a confounding factor.
Avoid measurement traps that distort CWV and SEO conclusions
- Changing too many variables at once: shipping a redesign, new content, and performance fixes together makes impact attribution weak.
- Overreacting to short windows: 7-day comparisons are volatile; use 28-day windows and revisit after 8–12 weeks.
- Bot and referrer spam: ensure filtering is on so “traffic gains” aren’t automated.
- Adding heavy A/B tooling during performance work: if the measurement stack slows pages, your test is compromised.
If you’re also optimizing for emerging search experiences, ensure your performance work doesn’t distract from how you earn visibility. A useful parallel is building defensible sourcing and citations for AI-driven results; see The Citation Moat Playbook for winning AI Overviews on non-brand searches.
What a good final report looks like
A strong internal report is short and specific:
- What shipped, on which pages, and when.
- How field CWV status changed for those pages.
- GSC: clicks/impressions/CTR/position changes (treatment vs control).
- Cookie-free analytics: organic entrances and conversion rate changes by landing page.
- Key confounders and what you did to control for them.
That’s usually enough to justify further performance investment—without adding tracking complexity that erodes the gains you just earned.